
Running a successful small business requires more than generating revenue. Owners need to understand how much money remains after expenses, whether current pricing supports profitability, and how financial decisions could affect future performance. Unfortunately, many business owners discover problems only after reviewing financial statements at the end of the month—or sometimes much later.
Small business profitability software helps close that visibility gap. By organizing revenue, costs, operating expenses, and financial assumptions into a consistent planning process, owners can understand their margins, identify their break-even point, and evaluate possible changes before making important decisions.
For owner-operated service businesses, the objective is not necessarily to implement a complex accounting platform. Often, the immediate need is much simpler: understand whether the business is making enough money, determine what needs to improve, and track progress from month to month.
MarginHarbor Profit Advisor is designed around these questions. The subscription-based financial planning application helps small business owners monitor profitability, compare financial scenarios, review monthly trends, and forecast future performance—all within a private online workspace.
What Is Small Business Profitability Software?
Small business profitability software helps owners evaluate how revenue, costs, and operating expenses combine to produce business profit.
Depending on the application, profitability tools may calculate gross margins, operating margins, contribution margins, break-even sales, or financial performance trends. Some products also support forecasting and scenario analysis.
These functions are related to accounting, but they serve a different purpose. Accounting systems record and classify financial transactions, while profitability planning tools help owners interpret financial information and evaluate decisions.
For example, a bookkeeping system might show that a company generated $40,000 in monthly revenue and incurred $34,000 in expenses. Profitability planning helps answer the next questions: What is the operating margin? How much revenue is required to break even? What happens if costs increase? Would a pricing adjustment improve profitability?
These are management questions that benefit from consistent calculations and understandable financial models.
Why Revenue Alone Is a Misleading Business Performance Metric
Revenue measures sales activity, not financial success.
A business generating $100,000 per month may appear stronger than a company generating $60,000. However, if the larger business incurs $98,000 in costs while the smaller company incurs $45,000, the smaller operation generates substantially more operating profit.
Consider two hypothetical businesses:
Business A
- Monthly revenue: $100,000
- Total operating costs and expenses: $98,000
- Operating profit: $2,000
- Operating margin: 2%
Business B
- Monthly revenue: $60,000
- Total operating costs and expenses: $45,000
- Operating profit: $15,000
- Operating margin: 25%
Business B produces $13,000 more monthly operating profit despite generating $40,000 less revenue.
This distinction matters when evaluating growth, pricing, hiring, and business sustainability. Without regular profitability analysis, owners may focus on increasing sales while overlooking deteriorating margins.
For a deeper explanation, read Gross Profit vs. Net Profit: Understanding the Difference.
Five Financial Numbers Every Small Business Owner Should Understand
A useful profitability dashboard should help owners interpret the financial measures that directly influence operating decisions.
1. Monthly Revenue
Monthly revenue measures sales generated during the reporting period. It establishes the starting point for profitability analysis and helps owners identify growth or contraction.
Revenue trends become more useful when compared with cost and expense trends. Higher revenue is not necessarily positive if the additional sales produce inadequate contribution.
2. Gross Profit and Gross Margin
Gross profit represents revenue remaining after cost of goods sold is deducted.
Gross Profit = Revenue − Cost of Goods Sold
Gross margin expresses that result as a percentage of revenue.
Gross Margin = Gross Profit ÷ Revenue × 100
These measures help owners understand the economics of delivering products or services before considering other operating expenses.
3. Operating Profit
Operating profit measures the financial result after deducting the operating expenses included in the model.
For a simplified small business analysis:
Operating Profit = Revenue − Cost of Goods Sold − Variable Operating Expenses − Fixed Operating Expenses
Operating profit helps owners determine whether ordinary business activity is generating a positive result.
It should not be confused with available cash, and a simplified planning calculation may differ from operating income reported under formal accounting standards.
4. Operating Profit Margin
Operating margin shows how much operating profit the business generates per dollar of revenue.
Operating Margin = Operating Profit ÷ Revenue × 100
If a business generates $8,000 in operating profit on $50,000 in revenue, its operating margin is 16%.
Monitoring this percentage over time helps identify whether business growth is improving profitability or merely increasing activity.
5. Break-Even Revenue
Break-even revenue estimates the sales required to cover the modeled fixed and variable costs.
It is particularly useful when setting sales targets, evaluating pricing changes, and assessing whether current business volume provides an adequate financial cushion.
A business operating only slightly above break-even may be vulnerable to modest declines in demand or increases in expenses.
A Practical Monthly Profitability Example
Suppose a service business reports the following monthly results:
- Revenue: $60,000
- Cost of goods sold: $27,000
- Variable operating expenses: $4,800
- Fixed operating expenses: $18,000
Gross profit is:
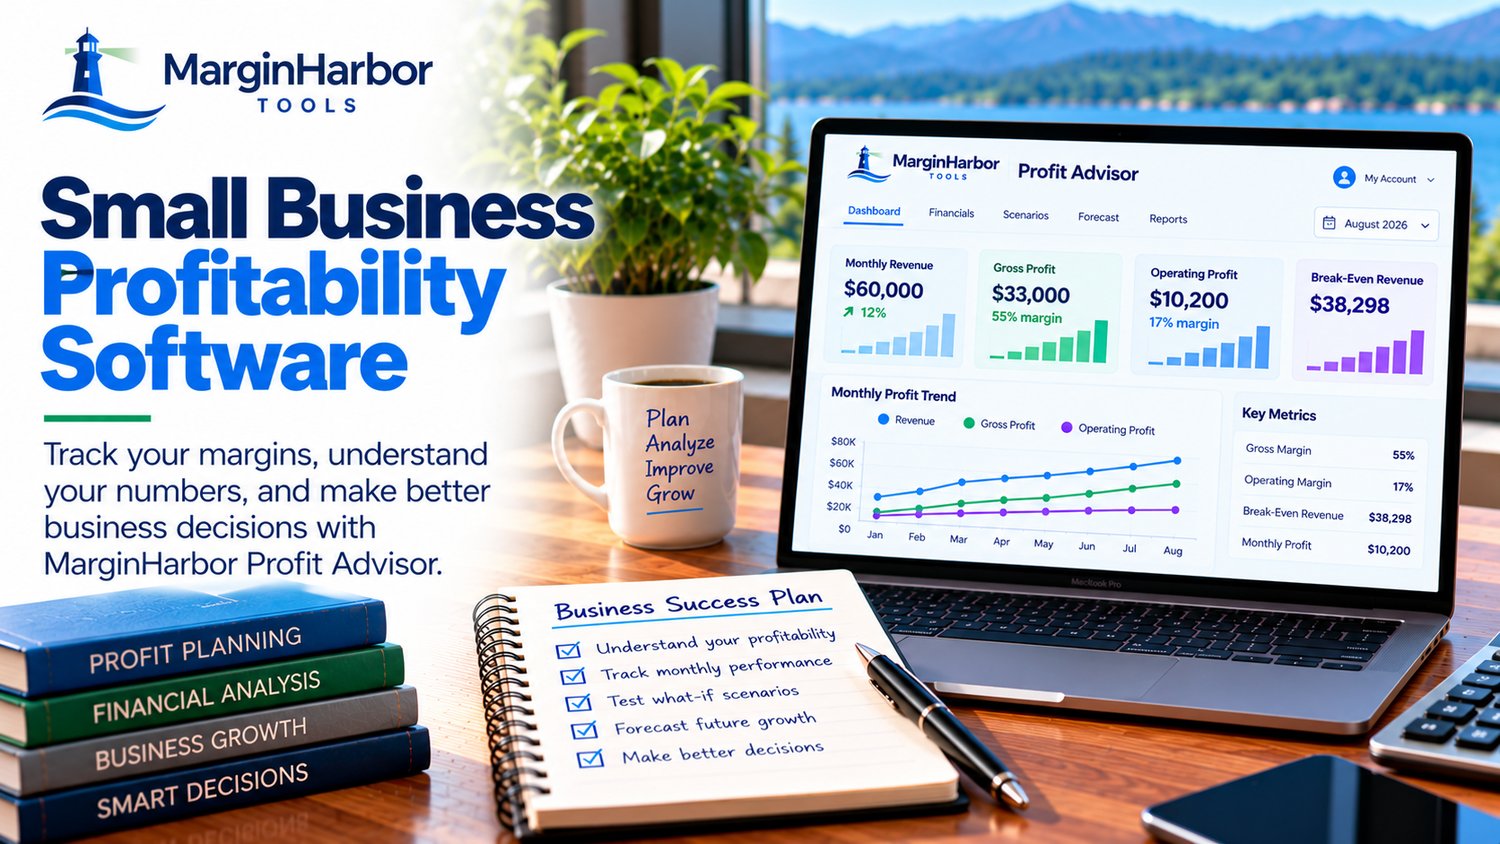
$60,000 − $27,000 = $33,000
Gross margin is:
$33,000 ÷ $60,000 × 100 = 55%
Operating profit is:
$60,000 − $27,000 − $4,800 − $18,000 = $10,200
Operating margin is:
$10,200 ÷ $60,000 × 100 = 17%
The business generates $10,200 in modeled monthly operating profit and retains 17 cents of operating profit for each dollar of revenue.
These calculations are useful individually, but their value increases when owners can compare results across months and evaluate alternative assumptions.
Try these calculations with your own figures using the free MarginHarbor Profit Advisor calculator.
No account is required to use the calculator.
Why Monthly Profit Tracking Matters
A single profitable month does not necessarily indicate that a business is financially healthy.
Revenue may fluctuate, supplier costs may increase, customer demand may change, and fixed expenses may gradually rise. Without consistent monthly records, these trends can remain difficult to identify.
For example, a company might experience the following operating margins:
- January: 22%
- February: 20%
- March: 17%
- April: 13%
Even if revenue remains relatively stable, the declining margin indicates that a smaller share of sales is becoming operating profit.
Management should investigate whether the change results from pricing, cost increases, lower productivity, or shifts in service mix.
MarginHarbor Profit Advisor allows subscribers to save monthly financial records and review trends in revenue, margins, and operating profit. This creates a consistent basis for comparing financial performance over time.
For more guidance, see How to Review Monthly Business Profit.
The Advantage of Financial What-If Scenarios
One of the most valuable uses of profitability software is evaluating potential decisions before implementing them.
Suppose a business owner is considering increasing prices by 10%. The higher selling price may improve contribution per transaction, but customer demand could decline.
A useful scenario should therefore consider both the price increase and a potential reduction in sales volume.
Other common scenarios include reducing supplier costs, hiring an additional employee, increasing marketing expenditure, or experiencing a temporary revenue decline.
MarginHarbor Profit Advisor supports named what-if scenarios that subscribers can save against their monthly financial records and compare with a baseline.
This allows owners to revisit assumptions rather than rebuilding calculations whenever a decision needs further consideration.
Why Break-Even Analysis Belongs in Your Financial Planning
Profitability analysis becomes more actionable when owners understand the minimum revenue required to cover operating costs.
Suppose a business has $15,000 in monthly fixed operating expenses and a contribution margin ratio of 50%.
Its break-even revenue is:
$15,000 ÷ 0.50 = $30,000
If current monthly revenue is $40,000, the business generates $10,000 in sales above its modeled break-even point.
That difference provides useful context for evaluating financial risk. If revenue declines substantially, the business may move closer to operating losses.
MarginHarbor Profit Advisor includes break-even calculations alongside profitability measures, making it easier to evaluate the relationship between current revenue and operating requirements.
Moving Beyond Spreadsheets Without Losing Control
Spreadsheets remain useful for specialized financial calculations, but maintaining monthly records, scenario comparisons, and historical trends across multiple files can become cumbersome.
A dedicated planning application offers a consistent environment for entering financial information and reviewing results.
MarginHarbor Profit Advisor provides private, account-based monthly records, named scenarios, profitability trends, and CSV exports. Subscribers can maintain an organized financial planning history without managing a separate collection of spreadsheets.
The application also supports 12-month forecasts based on recorded months and user-controlled growth assumptions. These projections are planning estimates, not guarantees of future performance.
Importantly, Profit Advisor uses transparent financial formulas rather than AI-generated financial recommendations.
Who Is MarginHarbor Profit Advisor Designed For?
Profit Advisor is particularly suited to owner-operated service businesses with approximately 1–20 employees.
Potential users include independent consultants, small agencies, home-service businesses, personal-service providers, and other owners who need practical visibility into monthly operating performance.
It is especially relevant when owners want to understand their break-even point, evaluate pricing or expense changes, and maintain a consistent record of profitability.
The application is not intended to replace full bookkeeping, invoicing, payroll, or tax-filing software. Its purpose is to support business planning and financial decision-making using the figures owners provide.
How Much Does MarginHarbor Profit Advisor Cost?
MarginHarbor Profit Advisor is available for $39 per month, with one subscription plan and the ability to cancel anytime.
The subscription includes private monthly financial records, saved scenarios, profitability trends, 12-month forecasts, and CSV exports. There is no free trial, and paid access continues through the end of the current billing period after cancellation.
For business owners who want to evaluate the calculations before subscribing, the public margin and break-even calculator remains free and does not require an account.
Start Understanding Your Business Profitability
Better financial decisions begin with understanding the relationship between revenue, costs, margins, and break-even sales.
MarginHarbor Profit Advisor brings these calculations together with monthly tracking, scenario comparisons, and forecasting in a dedicated business planning workspace.
Ready to move beyond occasional profit calculations and start monitoring your business month after month?
Get MarginHarbor Profit Advisor — $39/month
Or try the free profit margin and break-even calculator before subscribing.
Frequently Asked Questions
What is the best profitability software for a small service business?
The most suitable software depends on the business's needs. Owners requiring full bookkeeping should evaluate accounting platforms, while those primarily interested in monthly profit analysis, break-even calculations, and scenario planning may benefit from a dedicated planning tool such as MarginHarbor Profit Advisor.
Can profitability software help me increase my profit margins?
Profitability software can help identify financial trends, evaluate costs, and compare pricing or operating scenarios. These insights can support decisions intended to improve margins, but actual results depend on business conditions and the actions taken.
Does MarginHarbor Profit Advisor replace accounting software?
No. MarginHarbor Profit Advisor is a financial planning application rather than a bookkeeping, invoicing, payroll, or tax-filing system. It helps owners analyze financial information and evaluate decisions using the data they enter.
Is there a free version of MarginHarbor Profit Advisor?
The public margin and break-even calculator is free and does not require an account. The private business workspace, monthly financial history, saved scenarios, trends, and forecasting features require a $39 monthly subscription. There is no free trial for the subscription.
Can I export my financial records from Profit Advisor?
Yes. Subscribers can export their monthly records and forecasts as CSV files. The free calculator also supports browser-local saving and CSV export, although those local saves are separate from a subscriber's private online workspace.