
Monthly Profit Performance Dashboard — Business Profit & Loss Tracker
Track Your Revenue. Monitor Expenses. Understand Your Profit Margins.
Are you meeting your monthly revenue targets? Are operating expenses increasing? Is your business becoming more profitable over time?
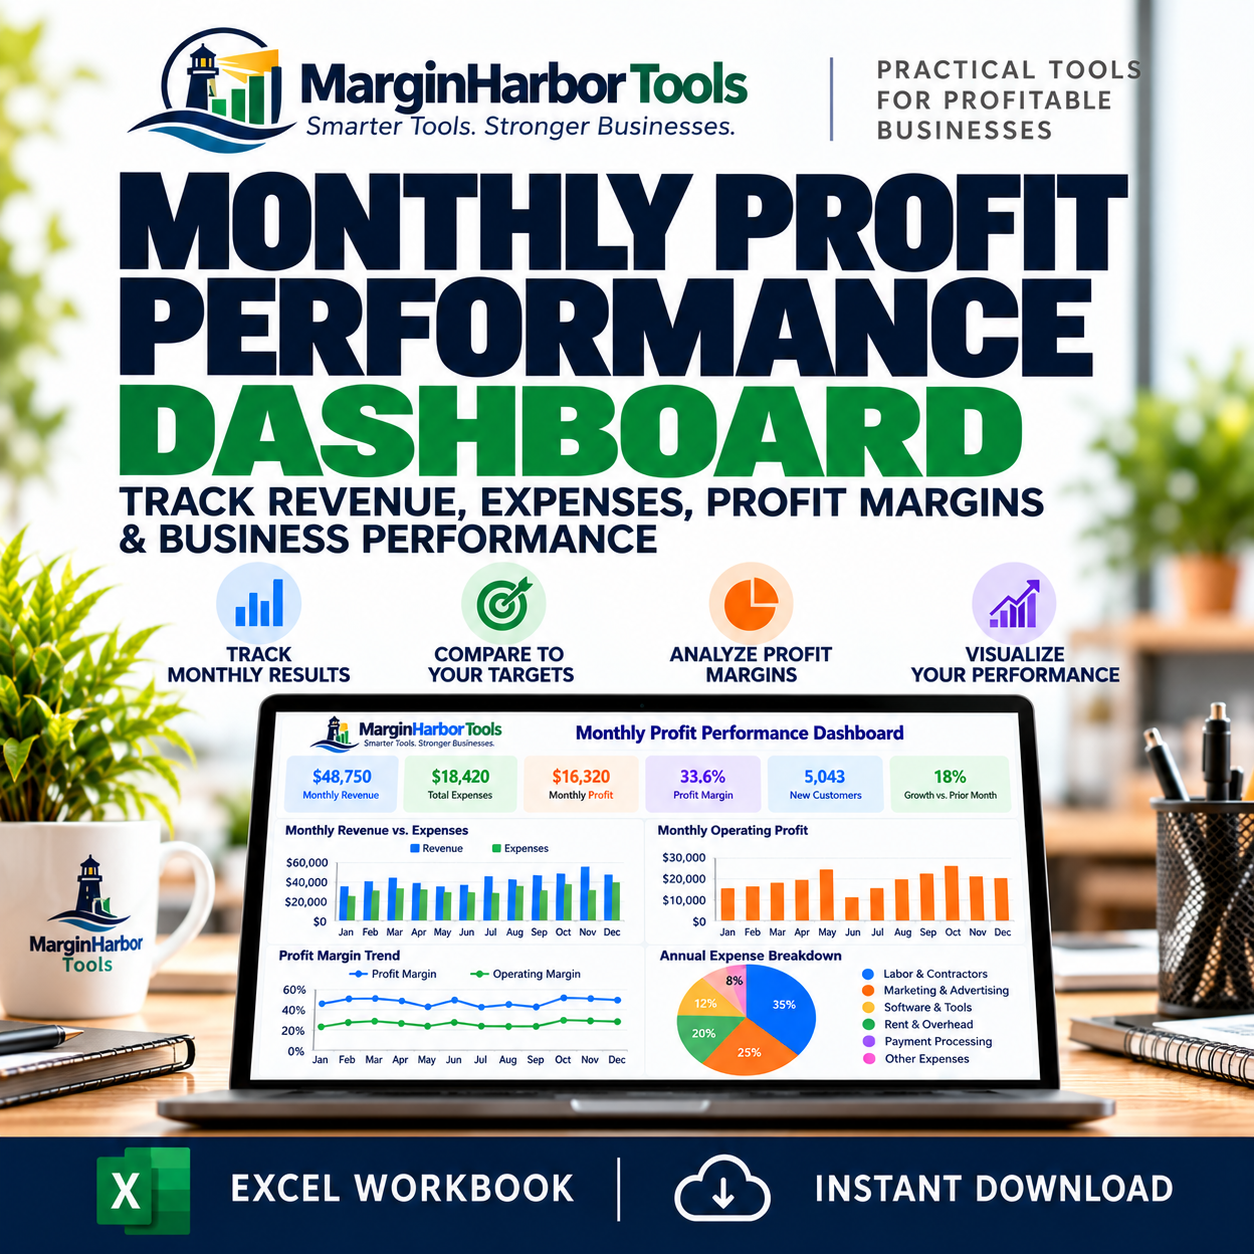
The MarginHarbor Monthly Profit Performance Dashboard is a downloadable Microsoft Excel workbook designed to help entrepreneurs and small business owners track financial performance, compare actual results against financial targets, and better understand business profitability throughout the year.
With customizable financial assumptions, monthly expense tracking, budget-versus-actual analysis, and interactive financial dashboards, you can turn your business numbers into clearer, more actionable insights.
What You Can Do
- Track Monthly Revenue: Monitor business income across a 12-month reporting period.
- Analyze Business Expenses: Record operating costs and understand how spending affects profitability.
- Compare Budget vs. Actual Performance: Identify differences between your financial targets and actual results.
- Monitor Profit Margins: Calculate gross profit, operating profit, and profitability percentages.
- Identify Financial Trends: Review changes in revenue, expenses, and profitability throughout the year.
- Visualize Business Performance: Explore financial charts, dashboards, and key performance indicators.
What's Included
- Microsoft Excel financial performance workbook
- Six integrated worksheets
- Customizable financial targets and assumptions
- Twelve-month revenue and expense tracker
- Budget-versus-actual financial analysis
- Gross profit and operating profit calculations
- Business profit margin tracking
- Visual financial dashboard with six KPIs and four charts
- Built-in instructions and illustrative sample data
Who Is This For?
- Small business owners and entrepreneurs
- Freelancers and independent professionals
- Consultants and service-based businesses
- Startups and growing companies
- Retail and e-commerce businesses
- Business managers monitoring financial performance
Whether you're reviewing monthly business results, preparing financial targets, or evaluating profitability trends, this workbook helps you understand your numbers and make more informed business decisions.
How It Works
- Set Your Financial Targets: Enter your monthly revenue goals, expense budgets, and financial assumptions.
- Record Monthly Results: Add actual revenue and operating expenses throughout the year.
- Review Budget Variances: Compare financial targets with actual business performance.
- Analyze Profitability: Evaluate gross profit, operating profit, and profit margin trends.
- Explore Your Dashboard: Use charts and key performance indicators to monitor your business's financial performance.
Product Details
Format: Microsoft Excel (.xlsx)
Delivery: Instant digital download
Purchase: One-time payment
Subscription: None required
Smarter Tools. Stronger Businesses.
MarginHarbor Tools is operated by Vision Publishing LLC.
This workbook is intended for business planning and management reporting. Financial calculations depend on the accuracy of the information entered. It is not a substitute for professional bookkeeping, accounting, tax, or financial advice.